James Ragan, CFA, Senior Vice President, Director of Wealth Management Research
Election Uncertainty Not Driving Investor Angst
The 2024 U.S. general election on 11/5/24 is just two months away, and we expect this topic will dominate the news cycle in the weeks ahead. Election coverage could increase financial market volatility as investors assess highly uncertain outcomes. Increased volatility has not increased to date (2024 through August), however, as U.S. equity markets have surged despite a pullback to begin September. Through 8/31/24, the widely followed S&P 500 index reflected a year-to-date (YTD) increase of +18.4% (price return, not including dividends), and the Nasdaq Composite (growth- and technology-centric) gained +18.0%. Leading factors contributing to 2024 gains, in our view, were solid economic growth, lower interest rates, and technology investment led by generative artificial intelligence (GenAI) projects. It appears to us that election angst has not weighed on investment returns this year and given many surprises in the presidential race to this point, along with still highly uncertain outcomes ahead including the congressional contests, we don’t believe the election has been a source of investor optimism either.
The Outcome Is Too Close to Call
We see a few factors contributing to investors’ apparent disinterest in the 2024 national election outcome. Races this year might just be too close to call. Vice President Harris was a very late entrant as President Biden didn’t step aside until 7/21/24, and by the end of the Democratic National Convention on 8/22/24, the election became a short 2½ month sprint to the finish.
Former President Trump has navigated numerous ongoing legal challenges while solidifying the Republican ticket, and over the past few months, election polls have vacillated between Trump and Harris (and previously Biden), especially in the seven “swing” states that are likely to determine the winner. While the election outcome remains highly uncertain, perhaps investors are less uncertain about policy changes as Kamala Harris is widely viewed as an extension of the Biden Administration with known policies, and because Donald Trump was president from 2017 to 2020, it is not hard to envision a second Trump Administration. Not only does the presidential race remain “up for grabs,” but the congressional races are hotly contested as well. Under the current Congress, the Republicans hold a slim 220 to 213 majority in the House of Representatives (House), with all seats on the ballot, and the Democrats hold a slim 51 to 49 majority in the Senate, with 34 seats on the ballot. A “split” Congress could remain split or go all red (Republican) or all blue (Democrat).
In our view, investors should avoid making broad portfolio changes due to election predictions as those outcomes are unpredictable, and legislative changes involve the president, the House, and the Senate, which we view as much more unpredictable for investors than following a prudent, well-diversified, long-term investment plan. The best-run companies, true leaders with great management and competitive advantages, can optimize results across business environments and political shifts.
Equity Markets vs. Party Control: President, House, and Senate
The period 1945 to 2023 covers 79 years and 14 presidents. Through 2023, the U.S. was led by a Democratic president for 39 years and led by a Republican for 40 years, with equity markets performing better on average under Democratic presidents. Since 1945, the U.S. equity market, as measured by the S&P 500 index price return, has averaged +11.1% annually under Democratic presidents, and +7.1% annually under Republicans. However, the numbers narrow when overlaying congressional party affiliation. When Republicans hold all three offices (president, House, and Senate), the S&P 500 has gained +10.1%annually; when Democrats hold all three, the market has gained +9.3%. We often hear that equity markets like divided government (more difficult to pass major legislative changes) and are fearful of one-party control, but the index has held up well and one-party control has been in place for 33 of the 79 (42%) years. The best annual market performance has come from a Democratic president and Republican control of the House and Senate (+13.0%). But over time, the dominant party has not correlated with higher returns as annual returns of +9.1% were identical when Democrats control two of three of the offices (40 years) and when Republicans control two of three (30 years).
We conclude that, historically, U.S. equities have produced solid average annual gains with either Democrat or Republican leadership. The S&P 500 has performed better with a Democrat president, although the best returns have come when Republicans control both the House and Senate, regardless of which party holds the presidency.
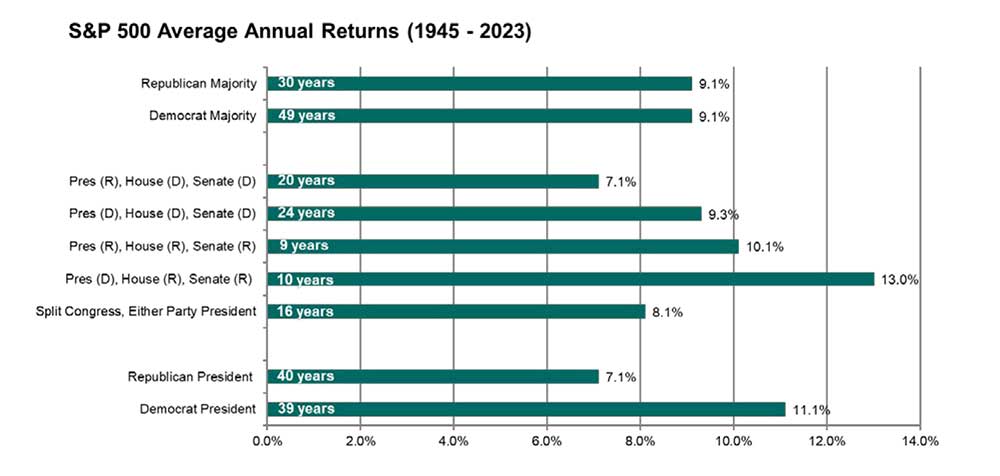
Sources: FactSet, www.house.gov, www.senate.gov, D.A. Davidson (12/31/1944 to 12/31/2023). Price Return does not include dividends. Returns are the average for any one year, returns are not compounded.
Close Elections Lead to Polarization
We agree with many pundits and investors that recent presidential election cycles are increasingly polarized. We attribute this to close election results, making predictions unreliable and fostering uncertainty. But we have been here before, with close elections and voter angst largely the norm in this century (since 2000). Presidential races are decided by the Electoral College, which has a total of 538 electors. The winner is declared by earning a majority of at least 270 electoral votes. Some might remember Ronald Reagan receiving 98% of electoral votes in 1984 (his 2nd term) and Bill Clinton reaching 70% in 1996 (also his 2nd term). In 2020, President Biden won with 57% of the Electoral votes, the same percentage earned by President Trump in 2016. President Obama achieved 62% (2012) and 68% (2008) in his two terms, a healthy margin but not dominant, and before that, President Bush (George W.) won twice with very tight margins of 53% (2004) and 50% (2000).
Polarization has also led to close races in Congress, which happen every two years with mid-terms following the general elections. Since the 2016 general election, covering the Trump and Biden Administrations, either the House or Senate has flipped parties three of the past four elections, and including the Obama terms (2008 election), the House or Senate has flipped in six of the past eight (75%) elections. By contrast, from 1980 to 2006, spanning 14 elections, a flip happened only five times (36%). One result of more frequent changes to the party composition of Congress, in our view, has been a realization by investors that large ideological policy changes become less likely, or less sustained, allowing companies to navigate the system successfully. But, with frequent changes in party control, neither party has been able to reign in annual deficit spending and the ever-rising federal debt, which will require several politically unpopular policy options.
On the revenue side is the debate about higher taxes (more revenue at first but lower growth) vs. lower taxes and regulation (less revenue at first but fosters growth), and the spending side (which is a larger issue relative to the size of the economy) includes concerns about potential Medicare and/or Social Security reform, defense spending, and interest payments on the national debt. Regardless of election outcomes ahead (2024 and beyond), these issues need to be addressed.
Polls and Betting Odds
As of 9/5/24, the Real Clear Politics (RCP) national poll average (sources from 8 independent national polls) had Democratic presidential candidate Harris up by 1.8 points, 48.1% to 46.3% for Republican candidate Trump. Harris’ odds improved steadily since President Biden announced his withdrawal in late July and peaked at 48.5% on 8/22/24 but have now eased a bit and leveled off. In the previous election, on 9/5/20, Joe Biden held a 7.0-point lead over Donald Trump, and on 9/5/16, Hilary Clinton was 3.6 points ahead (also vs. Trump). RCP also compiles data from six election betting sites where gamblers can wager on election outcomes. The RCP betting average is favorable to Trump 50.5% to 48.2% for Harris, one poll has Harris as the favorite, but another leans to Trump by a wide margin, 52% to 45%. Before Joe Biden exited the race, Trump had a large lead in the betting markets, a lead that has narrowed substantially with the rise of Kamala Harris.
Although Democrats currently have a two-seat majority in the Senate, they are defending 23 seats in 2024 (vs. 11 for the Republicans) and previously Democratic Senate seats in West Virginia and Montana are leaning Republican. This current majority gives a little cushion for the Democrat’s cause, and many key races appear very close. Senate results as of early September lean red, in our opinion, but we believe the final outcome remains up for grabs. Similarly, control of the House appears wide open as well, although in recent presidential elections the House did not flip until the mid-terms, remaining in Democrat control in 2000 (then flipped red in the 2022 mid-terms) and remained in Republican control in 2016 (then flipped blue in the 2018 mid-terms).
Beyond the polls, investors may look to the S&P 500 index to help predict the election outcome as the incumbent party tends to perform better when the S&P 500 is positive for the three months (August, September, October) prior to the election, but the data is more reliable when an incumbent president runs for re-election. In 2024, the incumbent has left the race, so we will have a new president in 2025. The last time that two consecutive presidents did not move onto a 2nd term was Gerald Ford and Jimmy Carter in the 1970s. This year, from 7/31/24 to 9/4/24, the S&P 500 index was essentially unchanged.
Research firm Strategas is watching the “Misery Index” which adds together the household unemployment rate and inflation data from the Consumer Price Index (CPI - both reported monthly on a year-over-year basis by the U.S. Bureau of Labor Statistics, BLS). Over the past 16 presidential elections, the relationship has held 15 times: when the combined number in October was below 7.4%, the incumbent party won; above 7.4%, and the incumbent party lost. In July 2024, the combined number was 7.2% (unemployment rate of 4.3%, CPI inflation rate of +2.9%). Both the August and September data will be reported prior to Election Day.
Investor and Market Expectations
In our opinion, financial market expectations for the 2024 election results (especially for president) are as uncertain as we can remember. In 2020, by September, investors had largely expected a Biden victory, which proved correct. The congressional races were more uncertain, but we discussed at the time how a Democratic sweep was possible, especially in the throes of the COVID-19 pandemic, and that indeed was the outcome. In 2016, investors overwhelmingly predicted a Clinton (Hillary) victory and Trump’s surprise win also drove a Republican sweep that was not on the radar. Our message is to stay humble and focus on economic and corporate fundamentals, and to avoid reactive investment moves during a changing political environment.
One 2024 expectation that we believe is held by many investors, at least currently, is continued two-party control, which likely includes a split Congress. But, given the 2024 Senate electoral map that favors Republicans, a win by Trump on the presidential ticket could drive a red sweep. While we won’t rule out an all-Democratic victory, which could ride Vice President Harris’ coat tails, we assign a blue sweep the lowest probability. We follow with discussion of three potential scenarios: 1) Trump wins with split Congress, 2) Harris wins with split Congress, and 3) Trump wins with Republican Congress.
No matter who becomes the United States’ 47th president in 2025, they will face numerous challenges. This includes a slowing economy that is highly dependent on consumer spending to avoid recession, numerous geopolitical hot zones that could pull the U.S. into a war, expiration in 2025 of the “Trump” tax cuts that will raise tax rates on most U.S. families, and a battle to raise the debt ceiling to fund the ongoing budget deficit. While the 2016 and 2020 elections included major policy changes (2016 was the debate over significant tax cuts and 2020 had deep discussion about the level of fiscal stimulus required once the post-pandemic recovery was under way), 2024 has fewer big ticket economic debates on the ballot. Both candidates face budget and tax issues.
Earlier, we discussed that the common perception that investment markets favor divided government and fear one-party control has not proven true when evaluating annual performance of the S&P 500 index. Recent history also pushes back on that narrative. In the 2016 election, President Trump’s surprise victory cemented an unexpected Republican sweep and market uncertainty, but in 2017, the S&P 500 gained +19.4%, its best performance in four years. Then, in 2020 as President Biden won, the Democrats flipped the Senate as well for a blue sweep. In 2021, the S&P 500 surged +26.9%, the best annual return of the Biden term. Below are our thoughts on possible election outcomes.
1. Donald Trump President, Split Congress
The Trump campaign has published its “Agenda 47”, listing 20 core promises of his Administration. In addition, here is a link to the 2024 Republican Platform. We focus on key proposals that can impact investors in 2025 as they can impact the outlook for economic growth and corporate earnings. This includes 1) increase oil and gas production; 2) incentivize domestic manufacturing (perhaps by imposing tariffs); 3) lower taxes for individuals; 4) invest in infrastructure; 5) invest in defense; 6) roll back regulations, including electric vehicle mandates; 7) and protect Social Security and Medicare. In recent press conferences, Mr. Trump has also discussed a plan to lower the federal corporate tax rate to 15% from 21%. A split Congress would limit potential for major legislation, especially for proposals tied to tax cuts or spending cuts. Other policies could be enacted without legislation (but sometimes challenged in courts) and this would include making it easier to drill for, and also to export, oil and gas, while at the same time rolling back electric vehicle mandates. More oil and gas production would lead to lower oil prices, limiting the earnings of oil and gas producers, but benefiting some refiners and pipeline companies.
Perhaps the most controversial Trump policy proposal is his support for tariffs as a tool used in trade negotiations and to create an environment to attract more domestic manufacturing. The downside of tariffs is that it raises the cost of goods for U.S. consumers, which can limit demand and weigh on corporate earnings. Mr. Trump has said that he could impose a 10% to 20% tariff on all imported goods, and up to 60% on many products made in China. This policy has been panned by investors, who would rather see open markets that allow companies to maximize profits. Trump has discussed using tariffs as a tool in trade negotiations to drive deals that promote U.S.-made products. We view a global tariff policy as a risk for investors. It is debatable to what extent a president can impose tariffs without congressional approval, although several loopholes already exist.
On the other hand, a Trump policy to roll back regulations could stimulate economic growth and help corporate earnings. Sectors that could benefit from easing regulatory burdens include Financials, Health Care, Utilities, and Energy. In 2017, President Trump and Congress passed the Tax Cuts and Jobs Act, which rolled back individual tax rates (top rate went to 37.0% from 39.6%), increased the standard deduction (now up to $29 thousand (K) for joint filers from $13K), gave a $2K child tax credit, and raised the tax-exempt joint inheritance transfer to $27.2 million (M) from $11.1M. To pass the TCJA, it included a sunset provision in 2025. Congress could agree to extend some of those provisions, but we believe that some higher tax rates are inevitable with a split Congress.
2. Kamala Harris President, Split Congress
The Democratic Party has not published a 2024 platform and instead provides links to its 2020 platform. However, Vice President Harris, as an integral member of the Biden Administration, has endorsed those policies. We used the Biden Administration’s 2025 Budget Proposal as a framework for a Harris platform. While she has publicly backed many provisions in the budget, she has added a few wrinkles on tax proposals. In general, Harris favors higher tax rates for high-income earners and the super-wealthy, as well as higher corporate tax rates. A split Congress significantly reduces the chances of an increase in the corporate tax rate (VP Harris has endorsed an increase to 28% from 21%) and/or the implementation of a wealth tax, but also will impede an extension of individual tax rates as the TCJA provisions expire.
While Harris appears to support some tariffs, her policies are likely to be more targeted and more supportive of globalization. This should benefit large U.S. companies that both sell and manufacture products around the world, including many companies in the Technology, Industrial, and Consumer Discretionary sectors. While VP Harris would like to limit profits for pharmaceutical companies, she supports more centralized health care, which can be good for managed care providers. We expect ongoing support for alternative energy producers and electrification, although passing additional spending bills with a split Congress is unlikely, in our opinion. With the U.S. facing a shortage of housing and home construction, this is a bipartisan area of possible legislation, although the Harris wish list for downpayment assistance would likely need a blue sweep to pass.
We expect a Harris Administration to continue the Biden pattern of resisting mergers and acquisitions (M&A) between large companies, which limits acquisition activity (often a source of investor profits). But beyond M&A, the Biden/Harris Administration has had broad support from Silicon Valley and the technology community, and we would expect that to continue, favoring that sector. Utilities could be an unexpected beneficiary of a Harris presidency if renewable energy mandates lead to regulated rate increase approvals and higher profits. We also believe that Harris would push for a more lenient immigration policy, which contributes to population and jobs growth, but raises other concerns as well. Unlike past Democratic regimes, the Biden/Harris Administration has been good for the defense industry, which we believe would continue.
3. Donald Trump President, Republican House and Senate (red sweep)
Unlike 2016, when the Republican sweep was largely unexpected, a 2024 red sweep would not be a huge surprise. The major policy implications center around tax rates and tariffs, but other than that, we don’t see widespread, Republican-led legislative changes impacting the economy and budget as the Senate 60-vote majority is required to pass most legislation. A simple majority (50 votes) can be used for items involving the budget (reconciliation) but then the revenue and spending impacts must be offset. This means that extending or making permanent the Trump tax cuts in 2025 must be offset by spending cuts, which will not be easy. In addition, legislation to take the corporate tax rate to 15% (with conditions) from the current 21% would require a spending offset as well. Republican control would make it easier for more tariffs, but we expect investor and market resistance to a blanket policy. Global tariffs could negatively impact multinational companies (much of the S&P 500) especially from retaliation, so the policy would favor domestic manufacturers selling to domestic customers.
Trump’s focus on reduced regulation and tax incentives can contribute to tame inflation numbers, helping to lower interest rates. Lower regulation and interest rates would benefit Financials, Utilities, Energy, and Real Estate. In general, the Technology sector has been more aligned with the Democratic party, but industry fundamentals to support spending on GenAI, cloud services, and data centers is not dependent upon political outcomes. Lower tax rates for individuals can help consumer spending, helping to drive economic growth, but the expectation is that the U.S. will continue to spend more than it receives, leading to an annual deficit and higher total debt.
S&P 500 Sectors: 2017-2020 (Trump Administration)
Below is the S&P 500 sector performance during the four years of the Trump Administration. The S&P rose +67.8% over the four-year period, led by Technology and Consumer Discretionary. Only those two sectors outperformed the overall index, and Energy was not only the worst performer, but declined -48.4%. Four years is a relatively long period of time, and the overall sector dispersion would be difficult to predict at the beginning of the term.
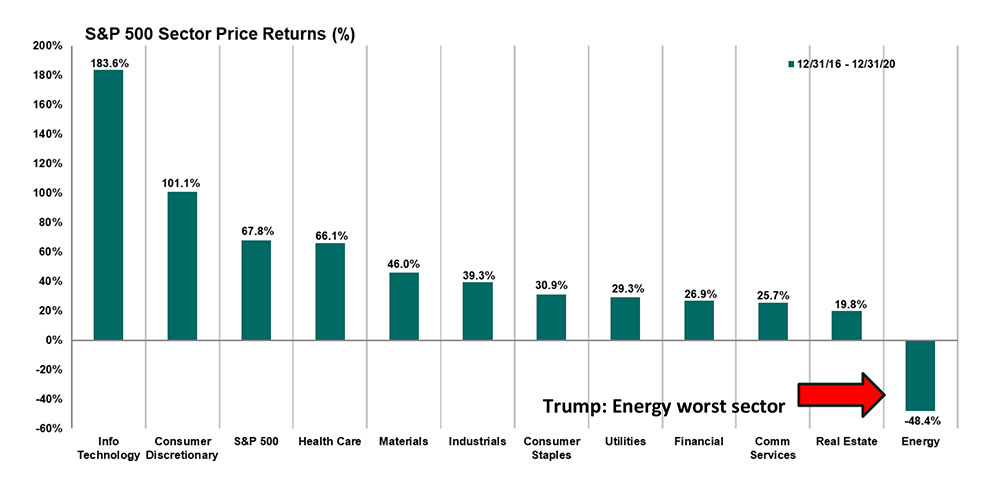
The information on indices is presented for illustrative purposes only and is not intended to imply the potential performance of any fund or investment. Indices provide a general source of information on how various market segments and types of investments have performed in the past. You may not invest directly in an index. Past performance is not an indicator of future results. The Global Industry Classification Standard (GICS) is a four-tiered, hierarchical industry classification system. Price returns reflect market appreciation or depreciation excluding the reinvestment of capital gains, dividends, interest, and other income. Presidential terms reflect a start date of January 1, not inauguration day. Data Source: FactSet. Trump chart represents 12/31/16 to 12/31/20. Biden chart reflects 12/31/20 to 8/28/24.
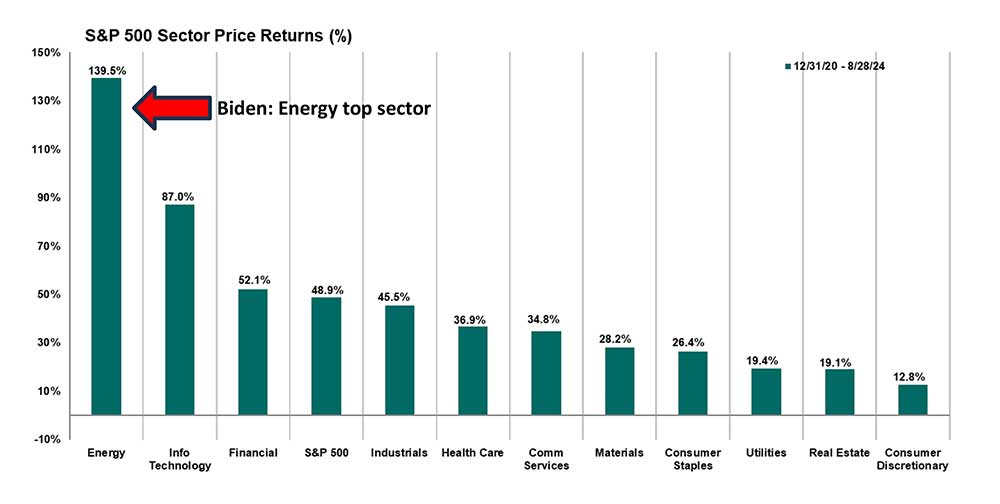
S&P 500 Sectors: 2021-2024 (Biden Administration)
Below is the S&P 500 sector performance during the 3.7-years (full term has four months remaining) of the Biden Administration. The S&P 500 has increased +48.9% from 12/31/20 through 8/28/24, led by Energy, Technology, and Financials. Just three sectors beat the index, and no sectors declined. As with the prior four years, long-term sector outcomes are difficult to predict, and over time, U.S. political party control is not a large factor in equity performance, in our opinion.
The information contained herein has been obtained by sources we consider reliable, but is not guaranteed and we are not soliciting any action based upon it. Any opinions expressed are based on our interpretation of data available to us at the time of the original publication of the report. Assumptions, opinions, and estimates constitute our judgment as of the date of this report and are subject to change without notice. Investors must bear in mind that inherent in investments are the risks of fluctuating prices and the uncertainties of dividends, rates of return and yield, as well as broader market and macroeconomic fluctuations and unforeseen changes in the fundamentals or business trends affecting the securities referred to in this report. Investors should also remember that past performance is not indicative of future performance and D.A. Davidson & Co. makes no guarantee, express or implied, as to future performance. The information is not intended to be used as the primary basis of investment decisions. Because of individual client requirements, it should not be construed as advice designed to meet the particular investment needs of any investor. It is not a representation by us, or an offer, or the solicitation of an offer, to sell or buy any security. Further, a security described in a report may not be eligible for solicitation in the states in which a client resides. D.A. Davidson & Co. does not provide tax advice and investors should consult with their tax professional before investing. Further information and elaboration is available upon request.
Market Indices: The information on indices is presented for illustrative purposes only and is not intended to imply the potential performance of any fund or investment. Indices provide a general source of information on how various market segments and types of investments have performed in the past. Index performance assumes the reinvestment of all distributions, but does not assume any transaction costs, taxes, management fees, or other expenses. You may not invest directly in an index. Past performance is not an indicator of future results. The Russell 2000® Index is a market cap weighted index that measures the performance of the 2,000 smallest companies in the Russell 3000® Index. The S&P 400 Index is a market cap weighted index comprised of U.S. stocks in the middle capitalization range, generally considered to be between $200 million and $5 billion in market value. The S&P 500 Index is a market cap weighted index that is designed to measure the US large-cap equity performance. The index is composed of the 500 leading publicly traded US companies based on size, liquidity, industry, and profitability criteria. The Dow Jones Industrial Average is a price weighted index that tracks 30 large, publicly owned companies trading on the New York Stock Exchange (NYSE) and the NASDAQ. The MSCI EAFE® Index (Europe, Austral, Asia, Far East) is a free float-adjusted market capitalization index that is designed to measure developed market equity performance, excluding the US and Canada. The MSCI Emerging Markets Index is a free float-adjusted market capitalization index that is designed to measure equity market performance in the global emerging markets.
The Global Industry Classification Standard (GICS) is a four-tiered, hierarchical industry classification system. Companies are classified quantitatively and qualitatively. Each company is assigned a single GICS classification at the Sub-Industry level according to its principal business activity. MSCI and S&P Dow Jones Indices use revenues as a key factor in determining a firm’s principal business activity. The 11 sectors are: Communication Services, Consumer Discretionary, Consumer Staples, Energy, Financials, Health Care, Industrials, Information Technology, Materials, Real Estate, and Utilities.
U.S. economic growth: Gross domestic product (GDP) refers to the monetary measure of the market value of all final goods and services produced within a country’s borders within a specific time period. Real GDP is adjusted for the impact of inflation. The most recent GDP report can be found at www.bea.gov. It is reported by the U.S. Bureau of Economic Analysis (BEA). Personal consumption expenditures (PCE) measure consumer spending on goods and services during the period, and is a component of GDP.
The Bureau of Labor Statistics (BLS) compiles U.S. labor statistics from two monthly surveys. The household survey measures labor force status by demographics, while the establishment survey measures nonfarm employment and data by industry. The nonfarm payrolls component of the establishment survey is drawn from private businesses and government entities. The nonfarm payrolls number is among the most widely used data points to assess U.S. employment trends. The unemployment rate is the percentage of the labor force that is jobless and actively willing and available to work.
The consumer price index (CPI) is a measure of average change, over time, in the prices paid by urban consumers for a market basket of goods and services. It is reported monthly by the U.S. Bureau of Labor Statistics.
Generative Artificial Intelligence (GenAI): We think of artificial intelligence as using advanced computers to process large amounts of data to ultimately approach human problem solving and decision making. Early versions were often called “machine learning” and could sift through large data sets and accurately predict single outcomes. Now, generative AI goes further to utilize all forms of inputs. While still predictive models, generative AI can give detailed responses, much better than a search engine, which does a good job of telling the user where to go to find additional information. As generative AI systems access more data, they become larger and learn to make better decisions. At each iteration, the system gains knowledge, enhancing its predictive (reliable) capabilities and ability to produce original content. Generative AI systems become more robust as they are used as all new data can be trained into the system, creating new challenges and opportunities.
Data on the part control of current and past Congress; can be found at www.senate.gov and www.house.gov. Information on past presidential results in the electoral college were provided by www.270towin.com.
Real Clear Politics is owned by Real Clear Media Group and it serves a news and polling aggregator by analyzing polling results from multiple qualified sources. We believe it can be used as an indicator of trends and sentiment, not necessarily of final results.
The U.S. Tax Cuts and Jobs Act was signed into law by President Trump on 1/1/18.
Copyright D.A. Davidson & Co., 2024. All rights reserved. Member FINRA and SIPC.